"Reuse and Repair: Enable New Life!"
A tenth of all waste is generated by households
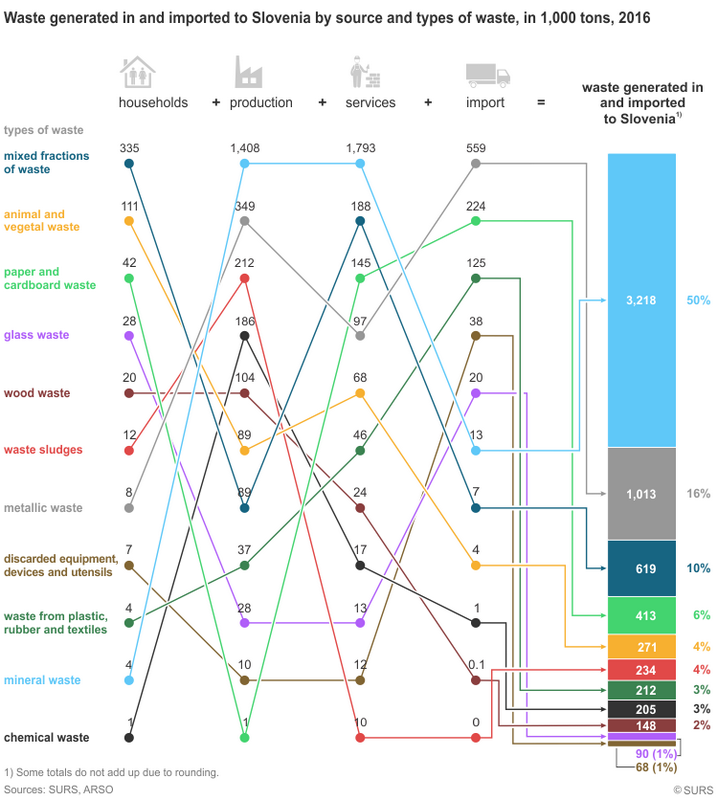
Of waste generated in Slovenia in 2016, 46% came from production activities, 44% from service activities and 10% from households.
Most of the household waste is mixed fractions of waste
More than half or 335,000 tons of waste generated by households was mixed fractions of waste. 69% of these were mixed municipal waste, 21% mixed and composite packaging and 10% other mixed municipal waste fractions.
Households also generated 111,000 tons of animal and vegetal waste, which was almost a fifth of all waste generated by households.
Most of the waste from production activities is mineral waste
More than half or 1.4 million tons of waste from production activities was mineral waste. 55% of the mineral waste was waste from incineration (ash, slag, boiler dust, etc.), 19% waste from various minerals, 13% waste soil and stones, and the remaining part was other mineral waste.
In production activities also 349,000 tons of metallic waste was generated, which is 14% of all generated waste in the production activities.
Most of the waste from service activities is also mineral waste
Almost three quarters or 1.8 million tons of waste from service activities was mineral waste. Here, among the mineral waste, construction and demolition waste in the form of soil and stones was dominant (53%) followed by construction and demolition waste (27%), waste in the form of earth excavations (19%), while other mineral waste was a minority share.
Almost one million tons of waste is imported (for recovery); 11% less waste is exported than imported
In addition to waste generated in Slovenia, in 2016 992,000 tons of waste was imported to Slovenia for the purpose of recovery. Of this, 56% was metallic waste, 23% paper and cardboard waste, 11% plastic waste and 10% other types of waste.
In the same year, almost 884,000 tons of waste was exported from Slovenia, also for the purpose of recovery. Of this, 39% was metallic waste, 20% mixed fractions of waste (mainly in the form of mixture of materials after mechanical treatment of waste), 14% paper and cardboard waste, 6% glass waste, and the remaining 21% other types of mostly separately collected fractions of waste.
Less than half of waste is recycled
Waste management covers recovery, disposal, export, and other waste treatment operations. Other treatment includes temporary storage and preparation of waste (sorting) for final treatment operations. The aim is to reduce the amount of waste generated, and already generated waste should be prepared for reuse, recycled or otherwise recovered, but should not be disposed of in the landfill sites.
The chart below shows the treatment of 6.5 million tons of waste generated in and imported to Slovenia in 2016.
Of individual groups of waste generated in and imported to Slovenia in 2016 the following were recycled:
• 85% of animal and vegetal waste
• 71% of paper and cardboard waste
• 66% of discarded equipment, devices and utensils (electronic equipment, end-of-life vehicles, batteries, etc.)
• 65% of metallic waste
• 44% of mineral waste
• 27% of glass waste
• 24% of waste from plastic, rubber and textiles
• 7% of mixed fractions of waste
• 5% of wood waste.
Of all waste generated in and imported to Slovenia, 62% of wood waste, 33% of chemical and medical waste and 16% of plastic, rubber and textile waste were used as fuel for the purpose of energy production.
41% of mineral waste generated in and imported to Slovenia was recovered with other recovery operations such as backfilling and using waste for covering the landfill sites.
14% of mixed fractions of waste were removed by landfilling.
The municipal waste recycling rate in Slovenia is higher than in the EU as a whole
According to Eurostat data for 2015, the municipal waste recycling rate in Slovenia was 54%, which is 9 percentage points more than in the EU-28 overall. Nevertheless, there is still much room for improvement in waste generation and treatment, with an emphasis on waste prevention. Waste treatment is namely connected with many negative effects on the environment (leaching water, greenhouse gas emissions, etc.). Data show that carbon dioxide emissions in the activities of waste collection, removal and treatment, and remediation of the environment in 2015 increased by 35% compared to 2014.


